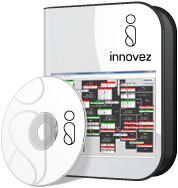
StatLink automates data acquisition from disparate sources and maintains a consistent, live enterprise database. This enables users to spend time adding value, not managing data.
 The increasing number of sources feeding data to the global natural gas and power industry means inefficiencies associated with the manual collection and organization of information are having a greater impact on competitiveness. Real-time data is essential, but can be tedious, costly and error prone to collect and organise manually.

Features include:
- Maintenance of a consistent, live, database.
- Contains european gas and power flow data; LNG, storage, linepack, capacity, supply and demand data
- Outage data for power generation and gas exploration
- Live data, upon publication and historic data available
- Infers unpublished data points, calculates aggregate values and handles unit conversion, enabling uniform data output
- Data search tool can locate by content, item name, country and raw dataset
- Customisable units, granularity, data types.
- Email and desktop alerts and data monitoring.
- Year-on-year statistical analysis and inbuilt charting.
- Accessible data formats such as; Excel, web API, JSON, XML, CSV and Python.
- Live Excel feed using Excel add-in tool or direct downloads from dashboard
- Custom data sources